Ben Keller · 5 September 2026
Archival Photographs Reveal Long-Term Shifts in Shoreline Plant Distribution Patterns
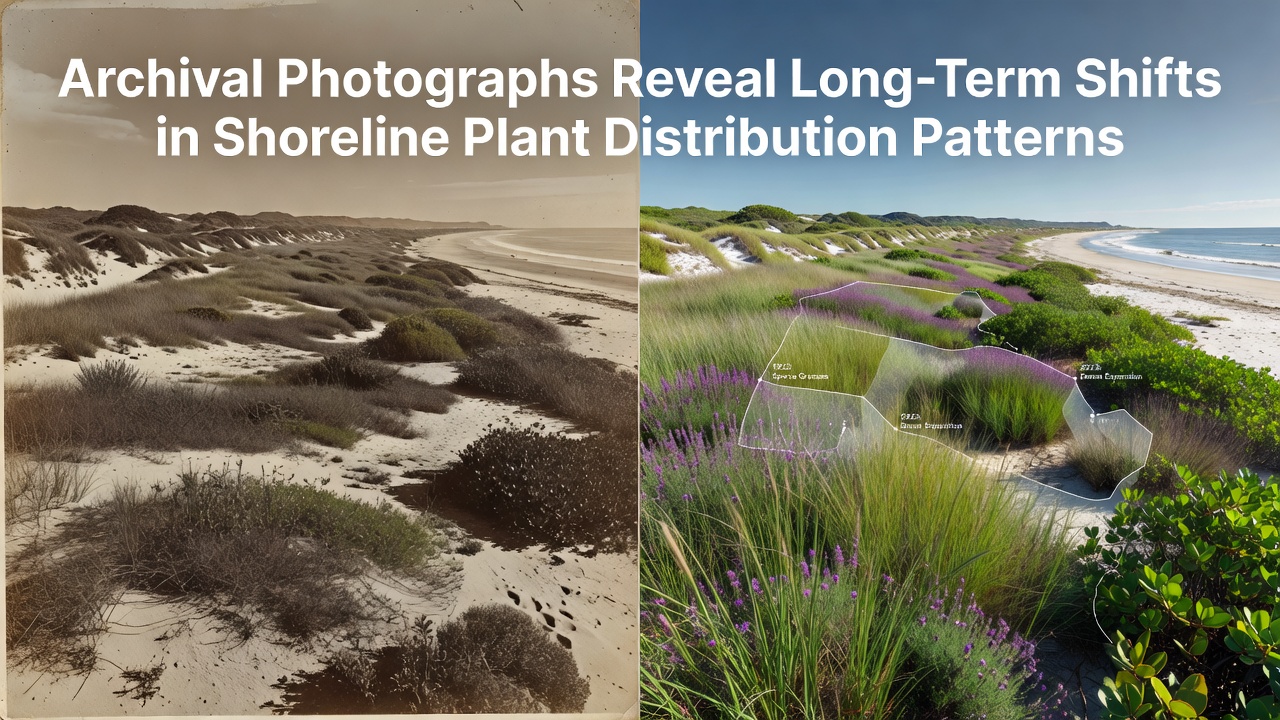
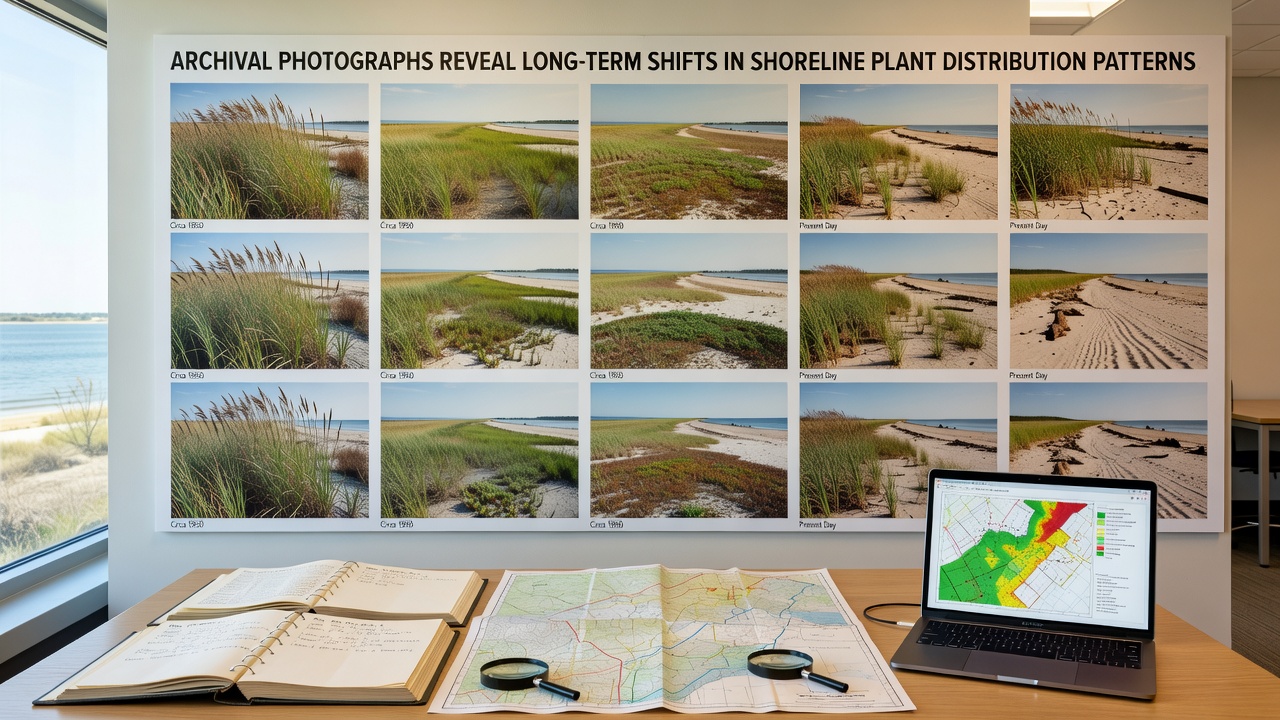
Researchers have turned to collections of historical photographs dating back to the late 1800s and early 1900s to track how shoreline plant communities have moved and changed over more than a century, and the patterns emerging from these comparisons show clear redistributions along coastlines worldwide. Teams at universities and government agencies scan and georeference these images, then overlay them with contemporary drone and satellite data to measure precise shifts in species locations and densities.
Building the Photographic Record
Early coastal surveys often included detailed images taken for navigation charts, engineering projects, and botanical expeditions, which captured salt marshes, dune systems, and mangrove edges before widespread development altered many shorelines. Observers note that these photos frequently show species like cordgrass and beachgrass occupying different elevations and latitudes than they do today, and cross-referencing with herbarium specimens helps confirm identifications. Data from repeated photography at fixed points along the US Atlantic and Gulf coasts, for instance, reveals that certain halophytic plants have migrated landward as tidal regimes shifted, while others have expanded into previously drier zones.
Similar archives exist in Australia and along European shorelines, where government mapping programs from the 1920s onward provide comparable baselines. Analysts at institutions such as NOAA integrate these records with modern surveys to quantify rates of change, and the resulting datasets span enough decades to distinguish seasonal fluctuations from longer-term trends.
Documented Distribution Changes
Comparisons consistently indicate that many shoreline species have moved poleward or to higher elevations where topography allows. In one multi-decade study covering sites from California to British Columbia, researchers found that pickleweed and saltgrass stands advanced upslope by several meters on average between 1950 and 2020, while lower-marsh species declined in areas experiencing accelerated erosion. Along the Baltic coast, archival images reveal that reed beds have thickened and extended into former open-water zones as winter ice cover decreased.
These movements align with measured changes in sea level and temperature, although local factors such as sediment supply and human alteration of hydrology also play roles. Figures compiled by coastal monitoring programs show that plant community boundaries have shifted at rates ranging from 0.5 to 3 meters per year in different regions, depending on slope and exposure.
Methods and Validation
Modern analysis relies on photogrammetry software that aligns historical camera angles with current terrain models, allowing precise measurement of vegetation edges and patch sizes. Teams also collect field data at the same locations during September 2026 surveys to ground-truth interpretations and account for seasonal growth stages. Where possible, they pair photographs with written field notes from the original surveys, which often list associated species and soil conditions. This combined approach reduces uncertainty that might arise from image quality alone, and repeated checks across independent photo sets strengthen confidence in the observed patterns.
Regional Examples and Drivers
Along the southeastern Australian coastline, repeated photography since the 1930s documents the gradual replacement of certain native grasses by more salt-tolerant succulents in areas affected by rising groundwater salinity. In northern Europe, records from the Wadden Sea show that pioneer marsh plants have colonized higher elevations on barrier islands as storm frequency patterns evolved. Researchers attribute part of these changes to altered sediment dynamics following river damming and coastal engineering, yet temperature and sea-level data remain the dominant correlates across large geographic scales.
One notable case involves sites in the Canadian Maritime provinces, where archival images from the 1940s capture extensive eelgrass meadows that later contracted and then partially recovered following conservation measures. Such recoveries remain localized, however, and overall trends point toward continued redistribution rather than simple expansion or contraction.
Implications for Coastal Ecosystems
Shifts in plant distribution affect habitat structure, sediment stabilization, and the availability of resources for coastal wildlife. As certain species move, associated invertebrates and nesting birds encounter new conditions, and these changes can propagate through food webs. Monitoring programs now incorporate photographic archives into predictive models that forecast future community composition under continued climate trends, and agencies use the results to guide restoration planting and setback planning.
Additional archives from South American and Asian coasts are being digitized, which will allow broader comparisons and help identify whether similar latitudinal and elevational patterns hold across different ocean basins. Collaborative efforts between botanical gardens, geological surveys, and environmental agencies aim to standardize methods so that new photographs taken in coming decades can extend the record seamlessly.
Conclusion
Archival photographs continue to supply one of the longest available records of shoreline plant responses, and ongoing digitization plus field validation ensure that these historical resources remain useful for tracking distribution changes. As new imagery becomes available and analytical techniques improve, the ability to quantify long-term patterns strengthens, providing coastal managers with evidence-based information for planning in dynamic environments.